A line graph titled "Cost Per Ton vs. Volume: Shipping Break-Even Point." The X-axis represents Shipment Volume in Metric Tons (MT), ranging from 100 MT to 10,000 MT. The Y-axis represents Estimated Freight Cost Per Ton in USD. Two lines are plotted: the Containerized FCL line starts at a moderate cost and remains relatively flat, showing a higher cost per ton at large volumes. The Bulk Cargo line starts very high at low volumes (reflecting fixed chartering costs) but drops sharply as volume increases, intersecting the Containerized FCL line at the Break-Even Point of approximately 4,000 MT. After the break-even point, Bulk Cargo becomes the significantly cheaper option per ton.

Bulk Cargo vs. Containerized Agro Transport: What Importers Should Choose | Cost Comparison Guide

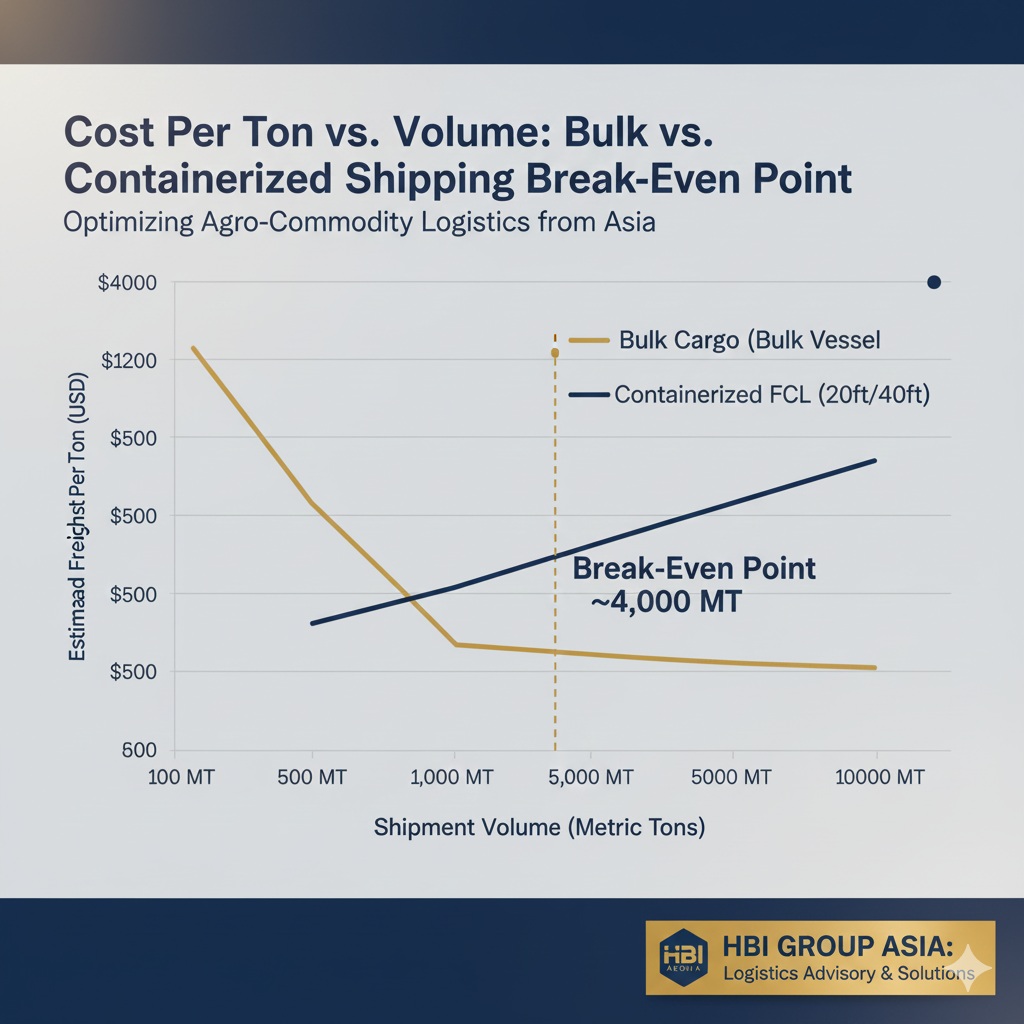
**The Shipping Break-Even Point:** Containers (FCL) are typically more cost-effective and secure for shipments under 4,000 MT. For large-volume orders (5,000 MT+), Bulk Cargo provides the lowest Cost Per Ton. Bulk Cargo vs. Containerized Shipping: Ultimate Cost Guide 👉 Get a Logistics Cost Breakdown Today Choosing the right shipping method—**Bulk Cargo** (Bulk Vessel) or **Containerized […]

Bulk Cargo vs. Containerized Agro Transport: What Importers Should Choose | Cost Comparison Guide Read More »