Supply Chain Visibility & Logistics

Stay updated with the development of the $BCOIN™ token the digital trade currency for real business. This category includes tokenomics, staking, mining game, DAO structure, and practical use cases inside the HBI Ecosystem™, giving readers insights into how blockchain empowers digital trade and financial inclusion.

Flowchart showing the HBI 5-Point Quality Control Chain from sourcing to final container sealing, with checkpoints for supplier verification, factory audit, SGS testing, loading supervision and secured export.

HBI Group Asia Commodity Quality Control

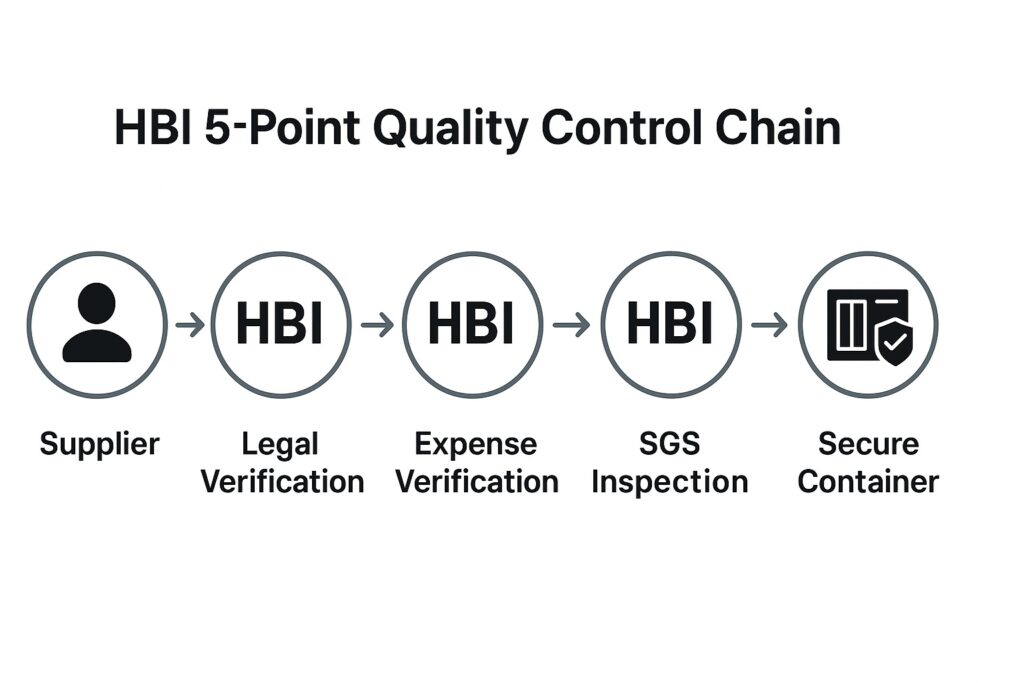
HBI Group Asia’s process ensures quality control at every stage, transforming Asian sourcing from a high-risk operation into a reliable, verifiable supply stream. How HBI Group ASIA Ensures Agro Commodity Quality Control 👉 Discover Verified Agro Commodity Sourcing In the dynamic market of Asian agro-commodity exports, quality control is not a luxury—it is the non-negotiable […]

HBI Group Asia Commodity Quality Control Read More »

A line graph titled "Cost Per Ton vs. Volume: Shipping Break-Even Point." The X-axis represents Shipment Volume in Metric Tons (MT), ranging from 100 MT to 10,000 MT. The Y-axis represents Estimated Freight Cost Per Ton in USD. Two lines are plotted: the Containerized FCL line starts at a moderate cost and remains relatively flat, showing a higher cost per ton at large volumes. The Bulk Cargo line starts very high at low volumes (reflecting fixed chartering costs) but drops sharply as volume increases, intersecting the Containerized FCL line at the Break-Even Point of approximately 4,000 MT. After the break-even point, Bulk Cargo becomes the significantly cheaper option per ton.

Bulk Cargo vs. Containerized Agro Transport: What Importers Should Choose | Cost Comparison Guide

**The Shipping Break-Even Point:** Containers (FCL) are typically more cost-effective and secure for shipments under 4,000 MT. For large-volume orders (5,000 MT+), Bulk Cargo provides the lowest Cost Per Ton. Bulk Cargo vs. Containerized Shipping: Ultimate Cost Guide 👉 Get a Logistics Cost Breakdown Today Choosing the right shipping method—**Bulk Cargo** (Bulk Vessel) or **Containerized

Bulk Cargo vs. Containerized Agro Transport: What Importers Should Choose | Cost Comparison Guide Read More »

A pie chart illustrating the 2025 agro-commodity export share in Southeast Asia: Indonesia 30%, Vietnam 24%, India 20%, Thailand 18%, Malaysia 8%. The chart visualizes each country’s leading commodity categories such as palm oil, rice, coffee, spices, rubber, cassava, and coconut products.

Top Agro Commodities to Import From Southeast Asia in 2025

Pie chart: Southeast Asia agro commodity export share (2025 estimate) — Indonesia 30%, Vietnam 24%, India 20%, Thailand 18%, Malaysia 8%. Data synthesis based on regional export reports for palm oil, rice, spices, coffee and rubber. :contentReference[oaicite:0]{index=0} Top Agro Commodities to Import From Southeast Asia in 2025 👉 Explore Our Commodities & Request a Quote

Top Agro Commodities to Import From Southeast Asia in 2025 Read More »

A clean digital bar chart representing the logistics performance of High Business International, showing rising export metrics across global markets with a modern blue and gold design.

Supply Chain Visibility And Logistics

Supply Chain Visibility And Logistics For Asian Rice Exports 👉 Get Your Quotation Now How Asian Rice Reaches Global Markets With Precision Rice supply from Asia serves more than half of the global population. While production happens in the fields of Vietnam, Thailand, India and Indonesia, the real challenge for global buyers lies in the

Supply Chain Visibility And Logistics Read More »

Bar chart comparing rice production volumes of Vietnam, Thailand, India, and Indonesia from 2019 to 2024, showing strong Asian growth and rising global supply influence.

Agricultural Products Inside Asia’s Rice Industry

Agricultural Products Inside Asias Rice Industry 👉 Get Your Quotation Now Inside The Heart Of Asian Rice Production Asias rice industry is one of the most advanced agricultural ecosystems in the world. From seed selection to harvesting and milling, every stage is supported by decades of expertise, fertile lands and large scale farming operations. This

Agricultural Products Inside Asia’s Rice Industry Read More »

Asian Rice Export Market Analysis (Million Tons)

Global Trade And Export Strategy: Rice Market Insights

Global Trade And Export Strategy Rice Market Insights 👉 Get Your Quotation Now Asia The Backbone Of Global Rice Supply Asia remains the center of global rice production, supplying nearly 90 percent of the worlds total demand. The regions fertile lands, experienced farmers and high capacity export systems make it the most dependable source for

Global Trade And Export Strategy: Rice Market Insights Read More »

Verified exporters use Trade Bridge Connect™ by High Business International™ to connect with real buyers, respond to RFQs, and manage international trade within a secure B2B ecosystem.

Trade Bridge Connect™: The B2B Marketplace Trusted by Verified Global Exporters

Trade Bridge Connect™ B2B Marketplace for Exporters Trade Bridge Connect™: The B2B Marketplace Trusted by Verified Global Exporters In the digital world of trade, not all B2B platforms are made for real exporters. Many are filled with unverified users, fake listings, and leads that go nowhere. That’s why serious exporters now rely on Trade Bridge

Trade Bridge Connect™: The B2B Marketplace Trusted by Verified Global Exporters Read More »

HTML Snippets Powered By : XYZScripts.com
Scroll to Top